Data Center Uptime and Seven Nines: What 99.99999% Power Availability Really Takes
Seven nines, or 99.99999% availability, allows 3.15 seconds of power loss a year: the budget of one hour-long outage every 1,141 years. Five nines allows 5.26 minutes. No Uptime Institute Tier certifies either figure. A single Texas grid feed delivered about 99.96% in 2025 and 99.69% in the 2024 storm year, so every further nine has to come from on-site generation, batteries and design. Here is the math for each nine, the outage evidence, and how to test a claim.
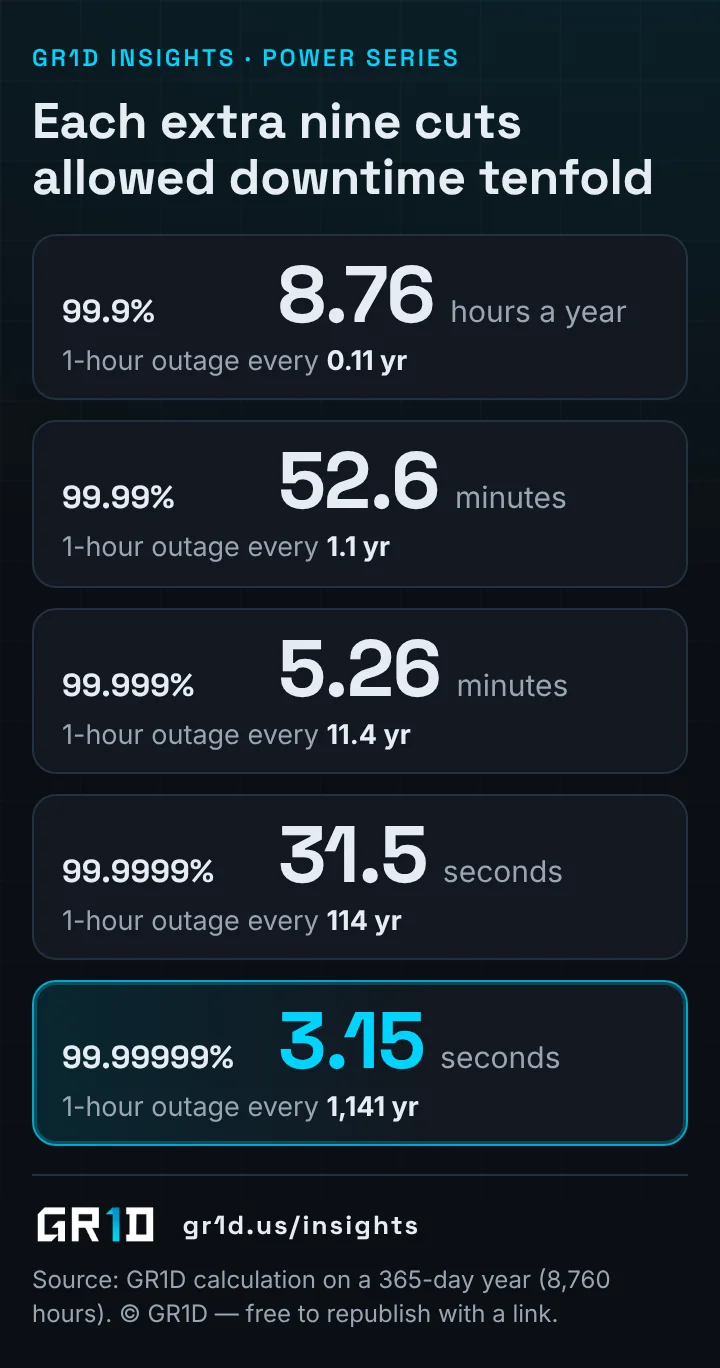
Read as text
- Each extra nine cuts allowed downtime tenfold
- 99.9% · 8.76 · hours a year · 1-hour outage every 0.11 yr
- 99.99% · 52.6 · minutes · 1-hour outage every 1.1 yr
- 99.999% · 5.26 · minutes · 1-hour outage every 11.4 yr
- 99.9999% · 31.5 · seconds · 1-hour outage every 114 yr
- 99.99999% · 3.15 · seconds · 1-hour outage every 1,141 yr
How much downtime does each nine of data center uptime allow?
Each extra nine cuts allowed downtime tenfold: 99.9% availability permits 8.76 hours a year, 99.999% permits 5.26 minutes and 99.99999% permits 3.15 seconds (GR1D calculation, 2026).
| Availability | Downtime per year | Per 30-day month | Same budget as one 1-hour outage every |
|---|---|---|---|
| 99.9% (three nines) | 8.76 hours | 43.2 minutes | 0.11 years, about nine a year |
| 99.99% (four nines) | 52.6 minutes | 4.3 minutes | 1.1 years |
| 99.999% (five nines) | 5.26 minutes | 25.9 seconds | 11.4 years |
| 99.9999% (six nines) | 31.5 seconds | 2.6 seconds | 114 years |
| 99.99999% (seven nines) | 3.15 seconds | 0.26 seconds | 1,141 years |
The last column is the one to remember: seven nines leaves no room for an hour-long event in a lifetime. Availability is also an average that hides lumps. Uptime Institute's 2001 benchmark put the best Tier IV sites at 99.995% over five years, which the same paper restated as 100% for four years and 99.954% in the year of the outage (Uptime Institute, 2001). Power downtime is not service downtime either: that paper allowed up to four hours for IT to recover, and Uptime's 2026 analysis warns that a major power failure at an AI training site "could prove expensive due to lost work, even if end-user customers are unaffected" (Uptime Institute, May 2026).
Availability, reliability or resilience: what is measured, and where?
A site can post 99.99% availability, 52.6 minutes down a year, with poor reliability, because availability counts time, reliability counts failures and resilience counts recovery (Uptime, 2017; NREL, 2020).
Uptime Institute calls availability "simply the arithmetic calculation of time a site was available over total time" (Uptime Institute, 2017). NREL defines reliability as the probability an item "will perform its required function under given conditions for a stated time interval" and resilience as the ability to "withstand and recover rapidly from disruptions" (NREL, 2020). For AI the difference is practical: fifty-two one-minute interruptions and one 52-minute interruption both score 99.99%, but the first restarts a training job fifty-two times.
The measurement point matters as much as the design:
- Utility meter. SAIDI and SAIFI count only interruptions longer than five minutes; momentary outages are excluded (EIA-861, Oct 2026), though they are what trips IT equipment.
- UPS output, the critical bus. Where source designs compare like for like, and where GR1D's model below measures.
- Rack inlet. Adds busway, PDUs, transfer switches and A/B cords. PDU failures figured in 19% of power-related outages in Uptime's 2026 survey, A/B transfer switches and single-corded IT devices in 16% each (Uptime Institute, May 2026).
- Service. Adds restart and resynchronization.
A nines claim without a measurement point and a period cannot be tested.
How often do data centers and the Texas grid lose power?
Power caused 45% of impactful data center outages in 2025, and Texas grid customers averaged 222 minutes of sustained interruptions that year (Uptime Institute, May 2026; EIA, Oct 2026).
Uptime Institute's 2026 analysis is the best public record of why data centers fail. Power led impactful outages at 45% in 2025, down from 54% in 2024; within power, respondents cited UPS failures (39%), transfer switches (34%), generators (28%), PDUs (19%) and controls (8%). Of last major outages, 57% cost more than $100,000 and one in five more than $1 million. Two-thirds to four-fifths involve human error, failure to follow procedures leads that list at 59%, and 87% of operators called their last impactful outage avoidable (Uptime Institute, May 2026). Uptime's line on the grid: "While grid failures should not result in a data center outage, transfers to generators sometimes fail."
On the grid side, US customers averaged about 11 hours without power in 2024, nearly nine of them from major events such as hurricanes (EIA, Dec 2025). EIA's utility data for 2025, released October 7, 2026, show Texas (EIA-861, Oct 2026):
| Service area | 2025 interruption minutes · count | 2024 minutes | Single-feed availability, 2025 / 2024 |
|---|---|---|---|
| Texas, all utilities reporting by IEEE method | 222 · 1.78 | 1,614 | 99.958% / 99.693% |
| CenterPoint Energy, Houston | 193 · 1.95 | 4,316 | 99.963% / 99.179% |
| Oncor, North Texas, non-IEEE method | 232 · 1.55 | 532 | 99.956% / 99.899% |
A single Texas distribution feed is therefore a three-nines source in a calm year and a two-nines source in a storm year: CenterPoint customers averaged about 72 hours of interruptions in 2024, the year Hurricane Beryl left 2.6 million Texas customers without power (EIA, Dec 2025). Sites fed at 138 or 345 kV have their own record; ask the utility for it. Every nine beyond three comes from inside the fence, which is why Uptime holds that "the only reliable source of power for a data center is the engine-generator plant" (Uptime Institute, 2017).
What do N+1, 2N and Uptime Tiers actually guarantee?
None of them guarantees a percentage: Uptime Institute dropped "expected downtime per year" from its Tier Standard in 2009 and assigns Tiers no availability predictions (Uptime Institute, 2021).
Redundancy counts spares and paths; basics are in How Data Centers Are Powered. In Uptime's 2025 survey, 42% of operators ran 2N and 41% N+1 (Uptime Institute, 2025).
| Topology | What it means | What it survives | What it still shares |
|---|---|---|---|
| N | Exactly the capacity the load needs | Nothing | Everything |
| N+1, block or distributed redundant | One spare module per group | One module failure | Bus, switchgear, controls; maintenance uses up the spare |
| 2N | Two independent paths to dual-corded IT | Loss of a whole path | Fuel, control software, people |
| 2N+1 | Two paths, each with a spare | A path plus a module | The same common modes |
Definitions follow DgtlInfra, Mar 2026. Uptime's Tiers sit on top: "A Tier III data center requires no shutdowns for equipment replacement and maintenance," and at Tier IV, when equipment or a distribution path fails, "the effects of the events are stopped short of the IT operations" (Uptime Institute, 2021). Uptime has issued more than 4,300 Tier Certifications in 120-plus countries (Uptime Institute); design-document awards made since 2014 expire after two years, and constructed-facility certification involves a site visit (Uptime Institute, 2017).
The familiar 99.671%, 99.741%, 99.982% and 99.995% for Tiers I to IV come from a 2001 Uptime white paper, where they were "drawn from industry benchmarking" of the top 10% of sites; the same paper said a Tier IV site "will not satisfy an IT requirement of 'Five Nines' (99.999%) uptime" (Uptime Institute, 2001). In 2009 Uptime "removed all references to 'expected downtime per year'," and "the current Tier Standard of Topology does not assign availability predictions to Tier levels" (Uptime Institute, 2021). Equating Tier IV with 99.995% cites a 25-year-old benchmark, not a certification.
How do you calculate data center power availability?
Independent parallel sources multiply unavailability while shared series parts add it, so grid plus generators can model above 99.9999% until one shared part adds minutes (GR1D analysis, 2026).
In parallel, unavailabilities multiply: a 99.958% grid feed backed by an independent source that is itself down 0.1% of the time leaves about 13 seconds a year. In series they add, so one shared switch, controller or fuel line sits on top of everything behind it. The first rule is how brochures reach seven nines; the second is how sites lose them.
GR1D modeled each configuration outage by outage, with sourced inputs:
- Grid: Texas interruptions for calm 2025 and stormy 2024, normal and major-event days (EIA-861).
- Diesel: well-maintained units start 99.87% of the time, run 1,662 hours between failures and take 37 hours to repair; poorly maintained units fail 1.65% of starts and run 61 hours between failures (NREL, Apr 2020).
- Gas engines on prime duty: 2.2% to 6.3% unavailable per unit; the low end applies NREL's failure and repair data to continuous running, the high end is NERC's 2020–2024 class average for diesel units (ISO New England/NERC GADS, Mar 2026).
- Batteries: 97% available, NREL's figure against vendor claims of 97% to over 99% (NREL, 2021); solar gets no firm credit.
| Configuration, measured at the UPS output | Calm year, Texas grid 2025 | Storm year, Texas grid 2024 | Weak point the math leaves out |
|---|---|---|---|
| Single grid feed, no backup | 99.958% · 3.7 h | 99.69% · 26.9 h | Sags and interruptions under 5 minutes |
| (a) Grid + diesel N+1, well maintained | 99.99998% · 5 s | 99.9987% · 6.6 min | Transfer switch, paralleling gear, fuel resupply |
| (b) Grid + gas engines N+1 + 30-minute battery | 99.9992–99.9999% · 30 s–4.1 min | 99.978–99.997% · 16–116 min | One gas supply feeds every engine |
| (c) Solar + 4-hour battery + gas N+1, grid backup | 99.9999–99.99998% · 5–31 s | 99.995–99.9995% · 3–27 min | Microgrid controller and protection |
| (c+) As (c) with N+2 engines and two independent 2-hour battery blocks | 99.999998% or better · under 1 s | 99.9995–99.99999% · 4 s–2.8 min | All of the above |
Five findings hold across the runs:
- Maintenance is the biggest lever. With NREL's poorly maintained diesel data, case (a) falls from 5 seconds to 20 minutes in a calm year and 13.6 hours in a storm year.
- Storm years cost one to two nines, because long outages expose running failures; NREL found one well-maintained generator only 75–87% likely to run two weeks.
- N+1 across many engines is thin. Nine engines needing eight, each unavailable 6.3% of the time, cannot carry the load alone 10.7% of the time; four needing three, 2.2%; ten needing eight, also 2.2%. NREL found an N+1 diesel-only microgrid's chance of carrying critical load through two weeks can fall to about 21% at summer peak (NREL, 2021).
- Battery hours buy storm-year nines, the case for the hybrid designs in our microgrid guide and for long-duration flow batteries.
- Seven nines on paper needs more than N+1. Only case (c+) models at seven nines in a calm year.
The table assumes independent failures. Real ones cluster:
- Fuel. In Winter Storm Uri, fuel issues caused 31.4% of unplanned generating-unit outages, 87% of them natural gas, as ERCOT shed 20,000 MW of load (FERC, Nov 2021). Behind-the-meter gas shares that gas system with the grid, and Uptime's Tier Standard requires 12 hours of fuel stored on site, gas included (Uptime Institute, 2014).
- Controls. Controls figured in 8% of power-related outages, and a microgrid adds a controller every source depends on.
- People. The human-error figures above apply to every design.
- Weather. A hurricane hits the grid, fuel deliveries and the site at once.
IEEE Gold Book data, as used in a 2014 vendor study, put an automatic transfer switch at about one failure per 100,000 hours (Active Power, 2014). Any shared part failing that often, with an hour to restore, is unavailable 0.001% of the time: 5.26 minutes a year, the whole five-nines budget. Holding seven nines needs each such part to fail less than once per 10 million hours. Identical machines rarely fail together: nuclear-plant data show one common-cause event against 153 independent diesel start failures in 2006–2020, a beta factor near 0.75% (INL, Aug 2022). The exposure is in what they share.

Read as text
- One shared part erases the extra nines
- GR1D model: downtime a year at the UPS output, log scale
- 1 s · 10 s · 1 min · 10 min · 1 h · 10 h
- Single Texas grid feed, 2025 · 3.7 h
- Grid + diesel N+1, well maintained · 5 s
- Hybrid: N+2 gas, two battery blocks · <1 s
- + one shared part failing once per 100,000 h · +5.26 min · = all of five nines
Why do voltage sags and ride-through matter for AI data centers?
IT equipment tolerates a dropout of only 20 milliseconds under the ITI (CBEMA) curve, so voltage sags shape AI data center power design as much as outages (ITIC, 2000).
The Information Technology Industry Council's curve, revised in 2000, says most IT equipment rides through ±10% indefinitely, sags to 80% for 10 seconds or 70% for 0.5 seconds, and a 20-millisecond dropout; it is "not intended to serve as a design specification" (ITIC, 2000). Anything slower needs stored energy in between:
| Event or device | Time | What it means |
|---|---|---|
| ITIC dropout tolerance | 20 ms | The window IT power supplies ride through |
| Double-conversion UPS transfer to battery | 0 ms | The standard for large data centers |
| Line-interactive or standby UPS transfer | 4–8 ms | Inside the window, with less sag correction |
| ERCOT Fast Frequency Response, full deployment | 250 ms | Batteries answer grid frequency events |
| Generator restores power, NFPA 99 rule | up to 10 s | 500 times the dropout window |
| NOGRR282 ride-through below 20% voltage | 150 ms | The site must stay connected and keep drawing power |
Double-conversion UPS has "zero transfer time to battery," against 4–6 ms for line-interactive and 6–8 ms for standby units (Vertiv); NFPA 99 gives generators 10 seconds (Minnesota Department of Health, Jun 2024). ERCOT's Fast Frequency Response must fully deploy within 0.25 seconds, and NOGRR272 with PGRR121 requires advanced grid support, which ERCOT calls similar to grid forming, setting voltage and frequency rather than following them, from new battery projects with interconnection agreements signed on or after April 1, 2026 (pv magazine, Oct 2026; ERCOT; ERCOT, Mar 2026).
AI adds the load side. Microsoft, OpenAI and NVIDIA engineers report training swings of "tens or hundreds of megawatts" concentrated at 0.2–3 Hz; a GB200 power floor of up to 90% of TDP costs a simulated 10.5% in energy, and rack-level storage "emerges as the best option" (arXiv, Aug 2025); see 800 VDC Data Centers and Vera Rubin.
The grid has felt it. On July 10, 2024 a failed lightning arrester on a 230 kV line caused six faults in 82 seconds; about 1,500 MW at about 60 data centers dropped, most of it because a protection scheme moves load to backup after three disturbances in about a minute, and it "did not return for hours" (NERC, Jan 2025; DCD, Mar 2025). After settings changes, a similar fault on April 18, 2026 cost only 500 MW, while a "nearly 4 GW customer-initiated load reduction" in Virginia in July 2026 is still under analysis (NERC, Sep 2026); Dominion told PJM's Operating Committee that about 3,800 MW of large load in its zone disconnected and moved to backup generation on July 22 after a normally cleared 230 kV fault (PJM, Aug 2026). NERC's Level 3 alert of May 4, 2026 asks for UPS settings and commissioning tests (NERC, May 2026; Utility Dive, May 2026).
Texas has written it down. NOGRR282, approved by the PUCT on July 9 and effective August 1, 2026, sets ride-through rules for Large Computational Loads (ERCOT). It applies to new sites; those approved before November 14, 2025 are exempt (ERCOT, Dec 2025). As presented in February 2026, it covers sites of 75 MW or more with at least half their load in power electronics, requires them to stay connected for 2 seconds at 80–90% voltage, 0.5 seconds at 50–80%, 0.25 seconds at 20–50% and 0.15 seconds below 20%, and bars trip or transfer schemes triggered solely by counting sags (ERCOT, Feb 2026). The logic that protected servers in Virginia is what the rule restricts, so UPS settings are now a grid-compliance item; see Getting Power in Texas.
What should a buyer ask before trusting a nines claim?
Ask where the number is measured, over what period and from which inputs; 99.999% means 5.26 minutes a year only if sags, maintenance and recovery count (Uptime Institute, 2019).
Uptime's research chief, Andy Lawrence, advises treating the number "and any SLAs that use this number, with extreme caution" (Uptime Institute, Oct 2019).
| Ask for | A good answer | A red flag |
|---|---|---|
| Measurement point and period | UPS output or rack, over named years | Five nines with neither |
| Basis of the figure | Model, inputs, sources and incident logs | Vendor MTBF figures alone |
| Design basis | Redundancy per subsystem; constructed-facility Tier Certification | A design-documents award only |
| Testing | Monthly 30-minute generator runs at 30% load or more, monthly transfer-switch operation | No loaded tests on record |
| Fuel | 12 hours or more on site, gas included, plus resupply contracts | Pipeline gas as the only fuel |
| Controls | Redundant controllers, a tested manual bypass, rehearsed islanding | One controller for every source |
| Ride-through | NOGRR282 settings tested with a 10% voltage step | Trip schemes that count sags |
| Common mode | Shared parts listed and costed in the model | Independence assumed |
Then run the sanity check: five nines allows one hour-long outage every 11.4 years, seven nines one every 1,141 years. A site with an hour-long outage in the past ten years has measured itself out of five nines for that decade. Fuel cells, in our Bloom Energy analysis, and solar plus storage in Texas change which parts are shared, not the arithmetic.
Frequently asked questions
How much downtime is 99.999% uptime?
Five nines allows 5.26 minutes of downtime a year, about 26 seconds a month; seven nines allows 3.15 seconds. The math is fixed, but the definition of downtime is not: ask whether sags, maintenance and IT recovery count.
Does a Tier IV data center guarantee 99.995% uptime?
No. Uptime Institute removed "expected downtime per year" from its Tier Standard in 2009, and the current standard assigns no availability predictions. The 99.995% figure comes from a 2001 Uptime benchmark of top-decile sites, averaged over five years.
What is the difference between N+1 and 2N?
N+1 adds one spare module to a shared system; 2N builds two complete, independent paths. In Uptime's 2025 survey, 42% of operators ran 2N and 41% N+1. N+1 still shares switchgear and controls.
Can a data center really achieve seven nines?
On paper, at the UPS output, yes: GR1D's model reaches 99.999998% or better in a calm Texas year with N+2 engines, two independent battery blocks and grid backup. Shared parts and human error cap measured results.
How reliable is the Texas grid for a data center?
Texas customers averaged 222 minutes of sustained interruptions in 2025, or 99.958% availability, and 1,614 minutes in 2024, or 99.69%, per EIA-861. Those figures exclude sags and interruptions under five minutes.
What is ERCOT's ride-through rule for data centers?
NOGRR282, effective August 1, 2026, requires new Large Computational Loads of 75 MW or more to stay connected through grid faults, for example 0.15 seconds below 20% voltage and 0.5 seconds at 50–80% in ERCOT's February 2026 draft, instead of dropping to UPS batteries. Sites approved before November 14, 2025 are exempt.
Sources
- Annual outage analysis 2026 — Uptime Institute, 2026-05-13
- Uptime Institute Global Data Center Survey 2025 — Uptime Institute, 2025
- Industry Standard Tier Classifications Define Site Infrastructure Performance — Uptime Institute (W. Pitt Turner IV and Kenneth G. Brill), 2001
- Myths and misconceptions regarding the Uptime Institute's Tier system — Uptime Institute Journal, 2017-07-20
- Explaining the Uptime Institute's Tier Classification System (April 2021 update) — Uptime Institute Journal, 2021-04
- Uptime Institute Tier Classification System — Uptime Institute, 2026
- Fuel system design and reliability — Uptime Institute Journal, 2014-06-18
- 99 red flags — Uptime Institute Journal, 2019-10-28
- Hurricanes in 2024 led to the most hours without power in the United States in 10 years — U.S. Energy Information Administration, 2025-12-01
- Annual Electric Power Industry Report, Form EIA-861 detailed data files (2025 and 2024 reliability) — U.S. Energy Information Administration, 2026-10-07
- Emergency Diesel Generator Reliability and Installation Energy Security — NREL, 2020-04
- Reliability of Emergency and Standby Diesel Generators: Impact on Energy Resiliency Solutions — NREL (Applied Energy accepted manuscript), 2020
- Resilience and economics of microgrids with PV, battery storage, and networked diesel generators — NREL (Advances in Applied Energy), 2021-08
- CCF Parameter Estimations, 2020 Update, Revision 1 — Idaho National Laboratory for the NRC, 2022-08
- NERC GADS EFORd class averages as used by ISO New England — ISO New England, 2026-03-12
- Final report on February 2021 freeze underscores winterization recommendations — FERC, 2021-11-16
- Mitigating Risk of UPS System Failure, White Paper 115 — Active Power, 2014
- Data center power: a comprehensive overview — DgtlInfra, 2026-03-28
- ITI (CBEMA) Curve Application Note — Information Technology Industry Council, 2000
- What are the different types of UPS systems? — Vertiv, accessed 2026-10-20
- Inspection and testing of emergency generators — Minnesota Department of Health, 2024-06
- Grid inertia is the new reliability — pv magazine USA, 2026-10-15
- NOGRR272: Advanced Grid Support Requirements for Inverter-Based ESRs — ERCOT, 2025-11-06
- Power Stabilization for AI Training Datacenters (arXiv 2508.14318) — Microsoft, OpenAI and NVIDIA authors, 2025-08-21
- Incident Review: Considering Simultaneous Voltage-Sensitive Load Reductions — NERC, 2025-01-08
- Virginia narrowly avoided power cuts when 60 data centers dropped off the grid at once — DCD, 2025-03-20
- Reliability Insights: Large computational load risks due to voltage sensitivity — NERC, 2026-09
- Level 3 Alert: Computational Load Modeling, Studies, Instrumentation, Commissioning, Operations, Protection, and Control — NERC, 2026-05-04
- NERC issues rare Level 3 alert over data center load losses — Utility Dive, 2026-05-05
- NOGRR282: Board Priority – Large Computational Load Ride-Through Requirements — ERCOT, 2026-07-09
- Large Electronic Load Ride-Through Requirements: NOGRR 282 and NPRR 1308 — ERCOT System Protection Working Group, 2026-02-24
- Batch Zero Update (Board item 14) — ERCOT, 2026-09-11
- Governor Abbott orders TCEQ to pause all permit issuance for data center projects — Bracewell, 2026-09-23
- Texas said it would halt data center permits; the state is pushing ahead anyway — 404 Media, 2026-10-19
- Texas continued data center permitting after the governor's pause — FracTracker Alliance, 2026-10-19
- Item 6.2: Large Electronic Load Ride-Through Requirements (NOGRR282 and NPRR1308) — ERCOT Board of Directors, 2025-12-01
- PJM, Dominion review large load transfer event — PJM Inside Lines, 2026-08-11
- Advanced Grid Support (AGS) incentive program concept overview, IBRWG — ERCOT, 2026-03-27
- TCEQ backtracks, suspends data center permits issued after investigation shows it ignored Abbott's pause — Public Citizen, 2026-10-22
- Texas environmental agency shuts down online permit filing system after data center controversy — The Texas Tribune, 2026-10-21
Building or financing an AI data center in Texas?
GR1D develops powered-shell and turnkey AI data centers — 20 MW to 150 MW sites with power, fiber and entitlements solved before the first rack arrives. See how we build, browse our sites or talk to us.